User Guide
Chi2 test
When checking the normality of a distribution our first intuition would be to draw a histogram of the distribution of the observed variables to see how closely it resembles a normalized Gaussian curve.
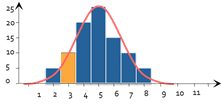
This is the exact principle behind the Chi2 test that adds to this intuition a small dose of statistical calculations. The principle is as follows:
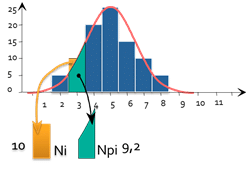
For each bar of the histogram we can calculate:
- Ni: The number of parts actually observed (here 10)
- Npi: The number of parts theoretically observed if it were a normal distribution (here 9.2)
- represents the “number of badly arranged parts”
We then calculate
,and find that D follows a distribution law due to the n-2 degrees of freedom (N being the number of classes). Consequently, we can calculate the probability of getting such a value
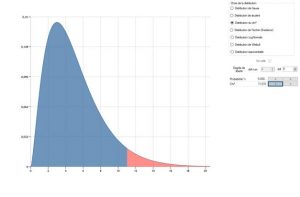
For example; for a histogram composed of 7 classes, if we calculated one d at 11.07 then we calculate that there are 5% that obtain this value, or more if the distribution law for the parts is actually normal.
The result of the test would therefore be 5% and we generally conclude in the following way:
- If X < 5%: the variables distribution law is not considered to follow a normal distribution
- If X >= 5%: the normality hypothesis is accepted and we consider that this distribution law follows a normal distribution.