User Guide
Various statistical tests
A statistical test (or testing a hypothesis) consists of detecting significant differences:
- Between a studied and a target value (Comparison test of a theoretical value or a conformity test).
- Between two populations (Comparison test of a population or homogeneity test)
- Concerning the linking of two variables (correlation or association test)
- With respect to data compatibility in relation to a distribution law (adequacy test)
From a data sampling, the statistical test will calculate the probability of obtaining a certain sampling configuration by assuming that the data is:
- Compliant with the target in the case of a comparison test for a theoretical value
- Homogeneous in the case of a population comparison test
- Perfectly associated in the case of a correlation test
- Compliant with a distribution law in the case of an adequacy test.
This hypothesis is called a null hypothesis because it assumes that there is no difference between the data.
Here are the statistical tests that are mainly used:
| Case studies | Parametric tests (hypothesise from a distribution law) | Non-parametric tests (Does not make a hypothesis from a distribution) |
|---|---|---|
| Comparison with a theoretical value | ||
| Equality of a frequency to a value | Test 1 P | |
| Average equal to a value | Theoretical test z Theoretical test t | Run test Sign test |
| Population comparison | ||
| Comparison of two paired populations | Paired t test | Paired Wilcoxon test Sign test |
| Comparison of the placement of 2 populations | z test t test | B to C Mann Whitney test |
| Comparison of the placement of k populations | ANOVA | Krustal-Wallis test |
| Comparison of two frequencies | Test 2P | |
| Correlations | ||
| Correlation of 2 variables | R ² and student coefficient | Spearman Coeft Kendal Coeft |
| Correlation of k variables with a Y | Multi-linear regression |
Population comparison :
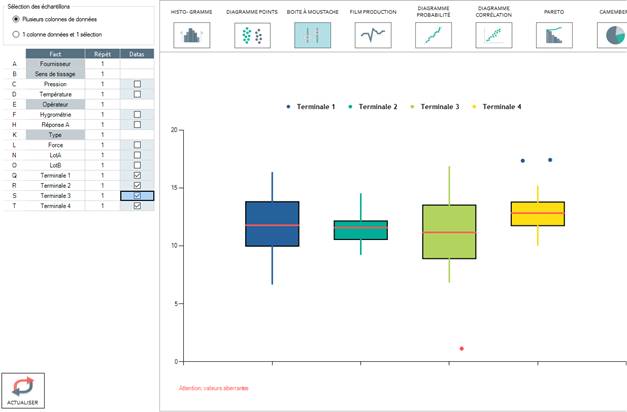
These tests allow for the comparison of several populations containing quantitative measurements among themselves. For example, batches produced by two different machines, the grades for different classes, etc...
Example 1: Does the red machine produce at a higher mean than the blue machine?

Example 2: You have take a sample of the grades in different maths classes. Are the grades of the different classes homogeneous on average and by variant?
Frequency test
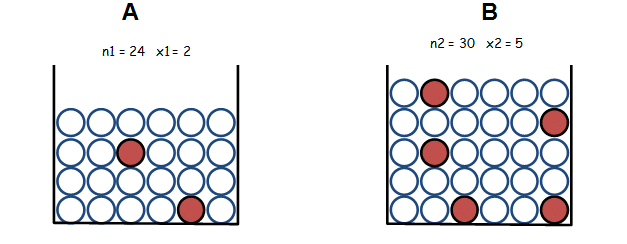
The frequency tests make it possible to compare the proportion of appearances of a phenomenon among several batches. For example, comparison of the proportion of defects between one production configuration and another.
Example 3: You received two batches from two different suppliers. With the data that you have available, can you tell if supplier A is significantly better than supplier B?
Example 4: According to the following results, is there a machining configuration that will significantly reduce the incidence of burs?
| P = 0,02 | P = 0,04 | P = 0,06 | |
|---|---|---|---|
| Without burs | 25 | 22 | 35 |
| With burs | 6 | 2 | 1 |
| Borderline | 4 | 3 | 0 |
Comparison test of a theoretical value:
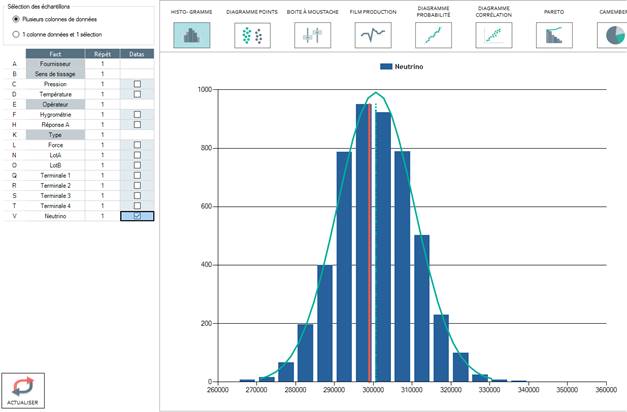
The comparison tests of a theoretical value enable the comparison of a population with a theoretical value.
Example 5: After measuring the following neutrino speed, can we say that they move at a speed significantly higher than the speed of light which is 299,000 km/s?
Example 6: Let us assume that there are 50% women in the population. In a company with 952 people, 440 are women and 512 are men. Is this a significant difference?
Correlation test:
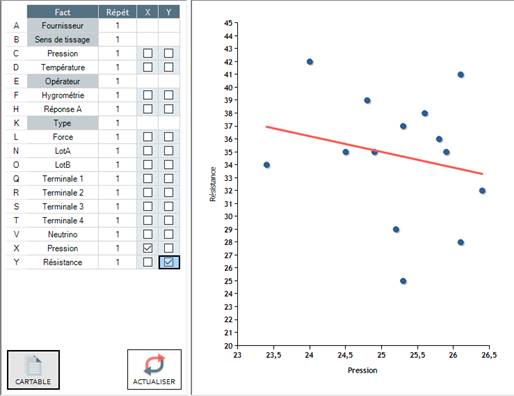
Correlation tests make it possible to verify if two quantitative variables seem linked.
Example 7: You measured the strength of a spring at a breaking point compared to the pressure at which it was produced. Does the pressure have an influence on the resistance of the spring?
Multiple linear regression test:
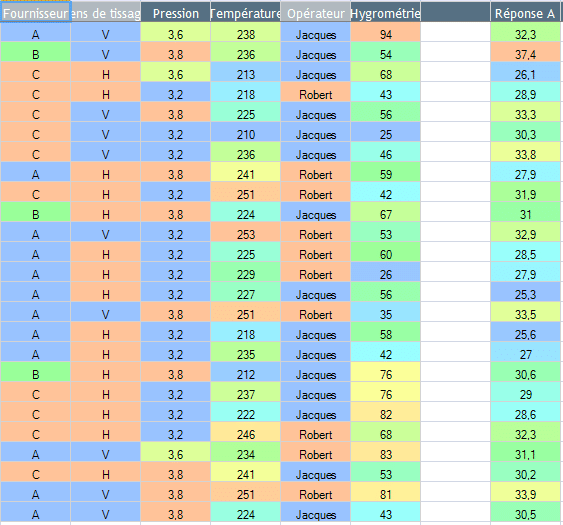
Also called large table analysis...This analysis enables you to find the influential factors on your Y when you have a large table of data containing Y's as functions of X on each line.
Example 8: You want to maximize result A in regards to different parameters that you have highlighted. What are the significant factors and how can the result A be maximized:
